Fertile land,from orbit.
Pick a satellite scene. AgriVision sharpens it, tunes its own colour bounds, masks the green, measures it in acres, reads the weather and soil at the site, and says which crops would grow there — every step on screen.
How a scene becomes a crop list
The paper's fusion pipeline, runningWatch it tune a scene, right here
Nothing leaves your browserSentinel-2 L2A · 2025-03-05 · 3.36 m/px · about 3.4 km across
- 1SharpenTrying Brovey weights…
- 2SeedReading every pixel's greenness…
- 3BoundsReading the seed's hue, saturation and value…
- 4Mask & measureWaiting for the bounds.
What the results look like
Reported, and computed liveTwenty districts across India, the model's crop against the Crop Weather Calendar's dominant crop. 15 of 20 matched; the paper reports 80 % accuracy counting the crops it ranked first.
Classification report — Table 3The paper's decision rules run on each scene's readings for the day it was taken. 6 of 10 scenes get a crop already grown there in the top four.
| Scene | Readings | Rulebook says |
|---|---|---|
| Al Kharj Saudi Arabia | 17 °C · 27 % · 34 mm/30 d | BarleyChickpeaDate palmMillets |
| Wadi Al-Dawasir Saudi Arabia | 26 °C · 28 % · 0 mm/30 d | Date palmMilletsSunflowerChickpea |
| Al-Ahsa oasis Saudi Arabia | 16 °C · 37 % · 25 mm/30 d | Date palmMilletsBarleyChickpea |
| Al-Busayta Saudi Arabia | 24 °C · 28 % · 5 mm/30 d | Date palmMilletsSunflowerChickpea |
| Tabuk Saudi Arabia | 23 °C · 21 % · 3 mm/30 d | Date palmMilletsSunflowerChickpea |
| Ludhiana India | 16 °C · 75 % · 76 mm/30 d | BarleyChickpeaMustardPotato |
| Anantapur India | 25 °C · 72 % · 36 mm/30 d | BananaBrinjalChickpeaGuava |
| Anand India | 20 °C · 63 % · 0 mm/30 d | BananaGuavaMangoRice |
| Thrissur India | 29 °C · 54 % · 15 mm/30 d | GuavaMangoChickpeaMaize |
| Mansoura Egypt | 22 °C · 56 % · 4 mm/30 d | ChickpeaDate palmGroundnutGuava |
Outlined chips are grown there today. The cloud adviser in the planner reasons further — it knows a desert pivot means irrigation.
Three kinds of land
All ten scenes are in the planner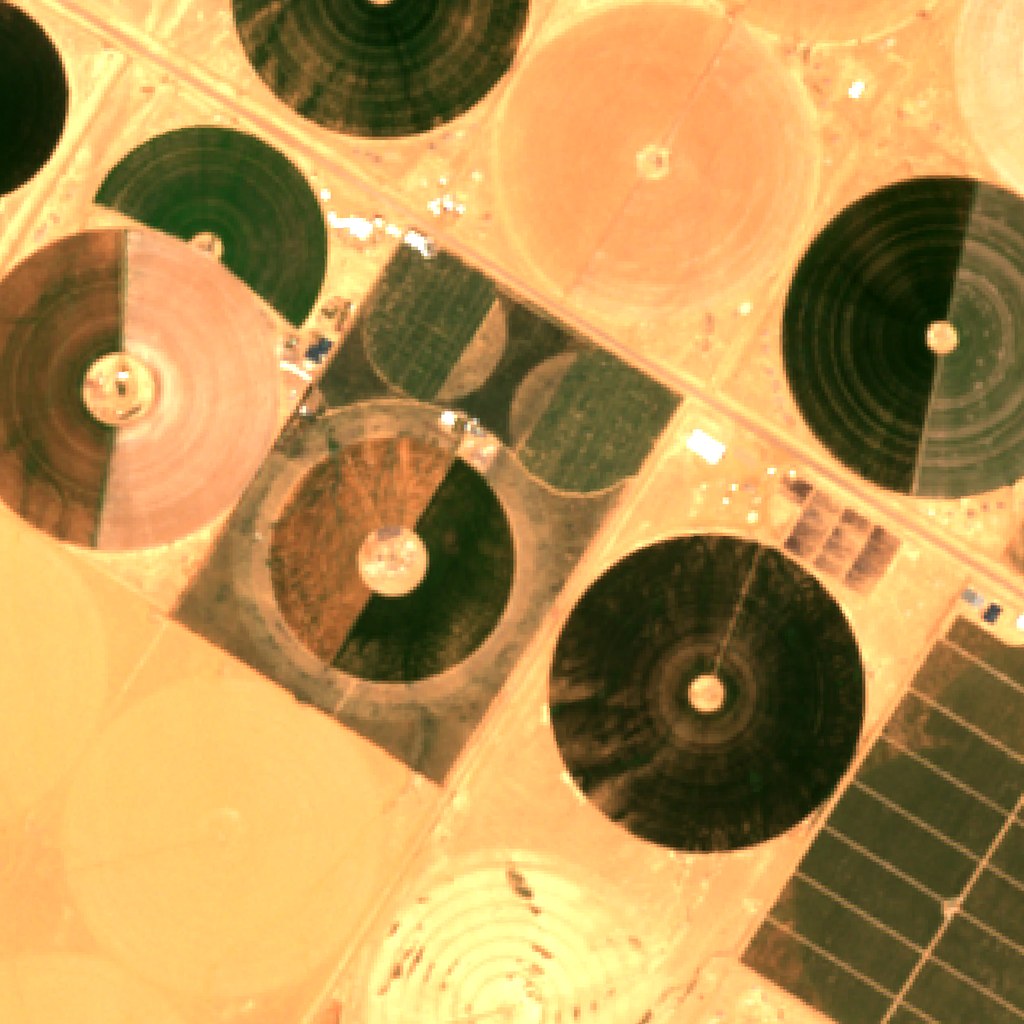
Irrigated circles on the Busayta plain. The tuner seeds on the discs, reads their hue and picks each one out of the sand.
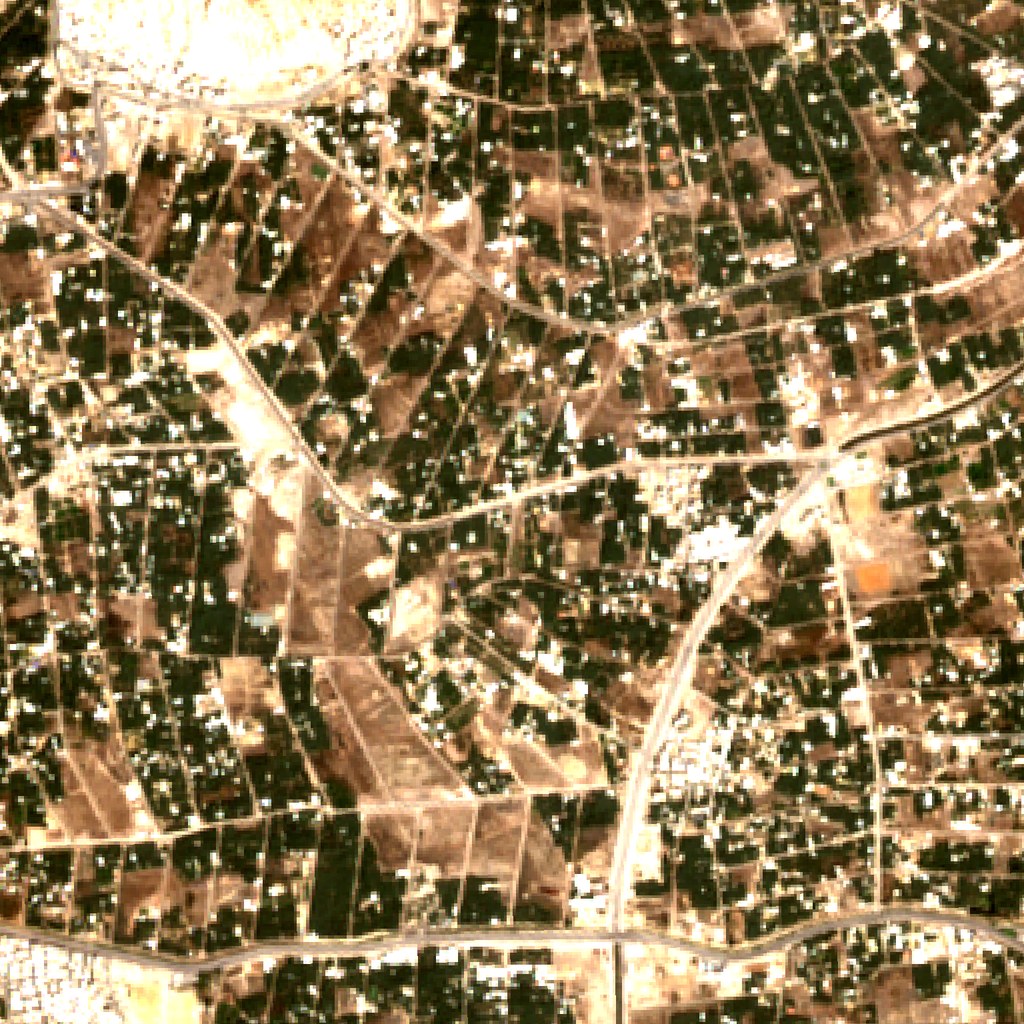
Date palms are a darker, duller green than a wheat field — the tuner lowers the saturation floor on its own to catch them.
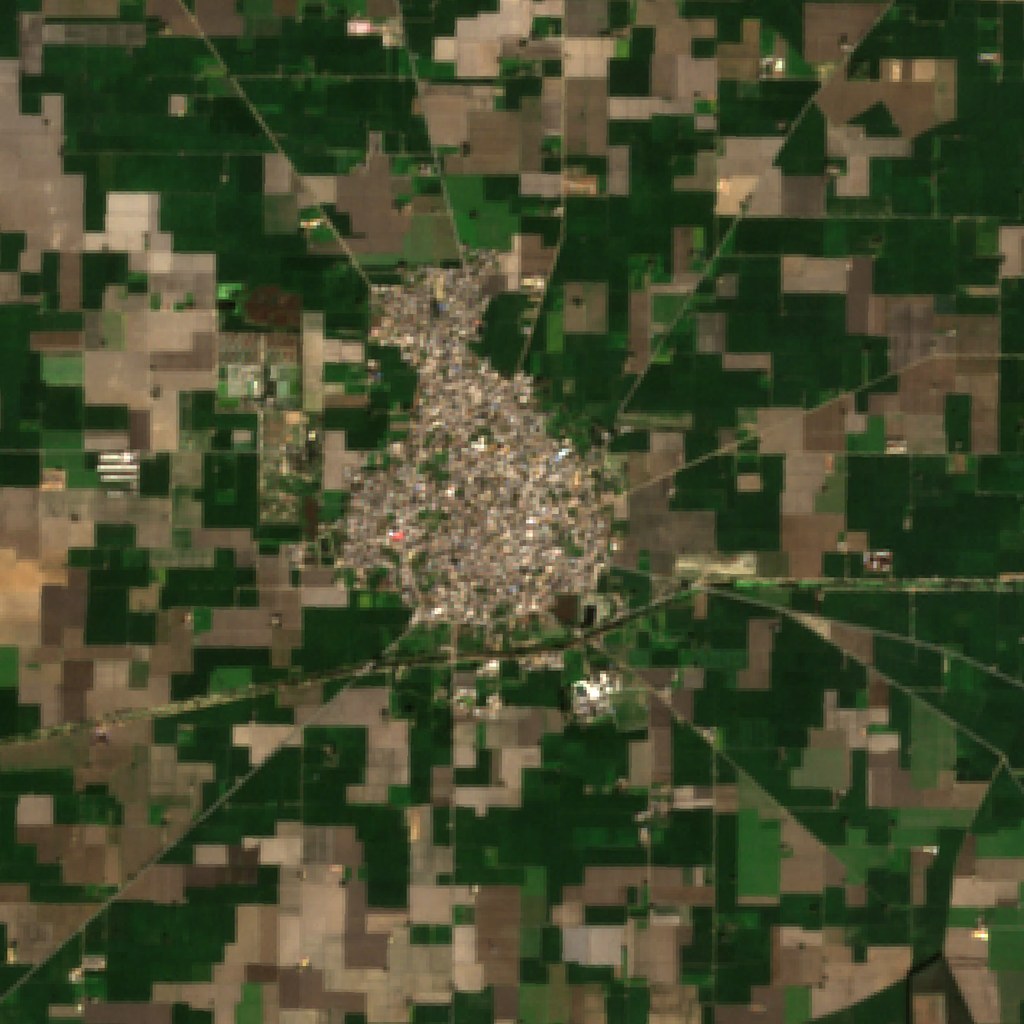
Wheat around a village in March. Here the bounds the tuner reads sit close to the paper's own, and the village falls out of the mask.
What the planner gets
No sliders. The tuner picks the sharpening weight, seeds on the scene's own greenness, reads the hue, saturation and value bounds off the seed and strikes the mask — step by step, on screen.
The paper fixed its scale to a map at 126 yd/cm. Here each scene carries its metres per pixel from the satellite, so acres and hectares are true to the ground.
The paper's decision rules answer instantly with a trace of every branch. A language model answers on request, with seasons and cautions. Both are checked against the calendar.
Thirteen attributes for the day the scene was taken — and a refresh to today when you want to plan for now.
Scenes and advice live in your browser's storage. No accounts, no database. Only the readings go to the adviser, and only when you ask.
One click exports the report — the scene, the acres, every reading, both advisers' crops — ready for a spreadsheet or a GIS.
The research behind it
AgriVision began as a university project and became a peer-reviewed paper: satellite scenes are pan-sharpened with the Brovey transform, converted to HSV and masked on the green hue; the area is converted to acres; weather and soil attributes are pulled for the location and fed to a generative model, whose crop suggestions were checked against India's Crop Weather Calendar.
This web version keeps the method and swaps the parts that needed a laptop for parts that run anywhere: the sharpening and the mask run in the browser on real Sentinel-2 scenes, the colour bounds are read off each scene instead of fixed by hand, the readings come from an open archive, and the R Shiny interface became this.
A fusion approach using GIS, green area detection, weather API and GPT for satellite image based fertile land discovery and crop suitability
Scientific Reports 14, 16241 (2024). Open access (CC BY 4.0).
AgriVision for your land
The demo here is free to try. For a farm group, a ministry or an agricultural company we set it up as a system — your imagery, your fields, your seasons — and price it for your area, not by the scene.
Measure a scene now
Ten scenes — pivots, oases and village fields — with the imagery, the readings and the calendar already in them. Pick one and watch it work.
Open the planner